- de
- en
Table of Contents
Developer Tools in the Browser
Whenever you work with HTML code, CSS, or JavaScript to customize the questionnaire even better to your needs, the developer tools in the browser are a great help.
Depending on the browser, you can find the developer tools in different locations:
- Firefox: Sandwich icon (≡) → More Tools → Web Developer Tools → Inspector
- Chrome: More options (⫶) → More Tools → Developer Tools → Elements
- Edge: More options (⋯) → More Tools → Developer Tools → Elements
All three browsers allow you to open the developer tools on Windows using the keyboard shortcut Ctrl + Shift + I (letter i).
Inspecting HTML Code
The Inspector (or similar) shows the HTML code on which the current page is based. This is especially useful if you want to:
- Identify element IDs or
- Understand and modify the CSS styles of elements.
At first glance, the HTML code may not seem very clear. However, using the selection tool, you can directly select individual elements on the questionnaire page.
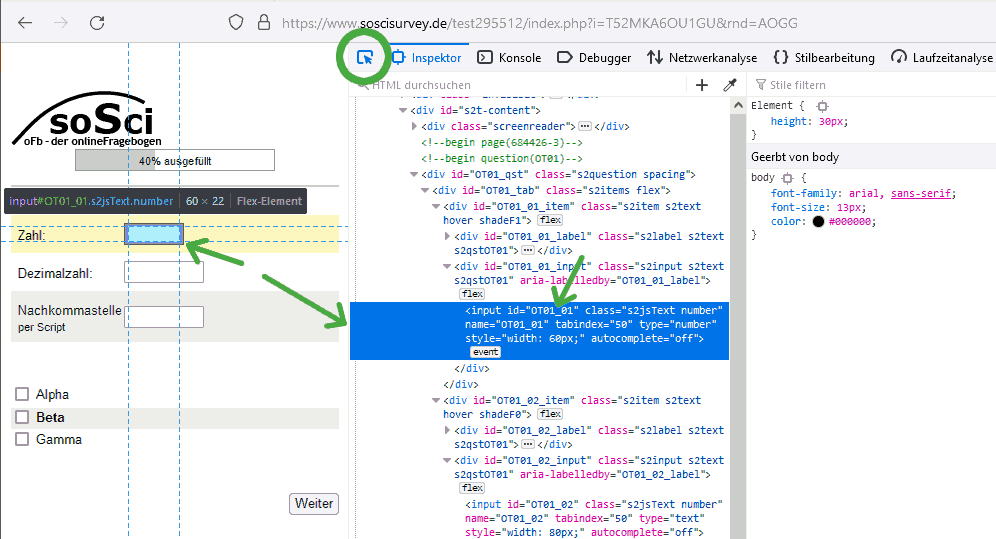
This allows you to easily find an element’s HTML ID, relevant CSS classes, and parent HTML elements. Additionally, on the right side, you can see which CSS rules are responsible for the element’s current styling. You can also modify them temporarily to test the effects of potential changes.
Error Console
Another tab in the developer tools is the error console (“Console”). This is particularly helpful when:
- JavaScript is not working correctly, or
- Images, audio elements, or videos are not functioning properly.
JavaScript Issues
Not all messages in the console indicate problems. Reading these messages correctly requires some practice.
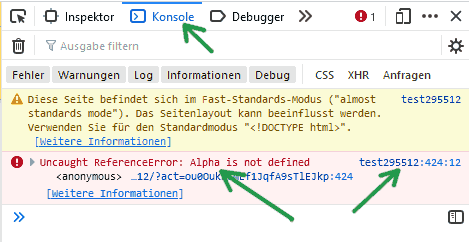
To the right of the error, there is usually a reference to the file in which the error occurred (a webpage typically consists of an HTML document and multiple linked files, such as images). Click on the line number to see the problematic code section.
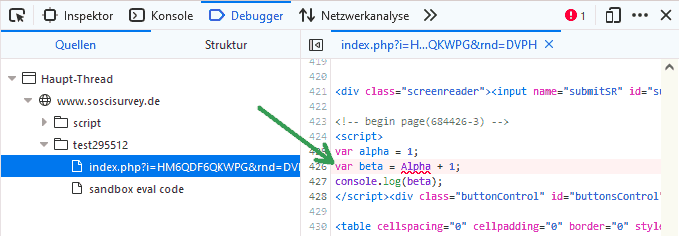
In this example, we see JavaScript directly inserted into the questionnaire. The term “Alpha” (mentioned in the error message) is highlighted … because the variable alpha was defined with var alpha, but here the script tries to access Alpha. JavaScript is strictly case-sensitive.
=If clicking on the line number in the console only shows “please reload,” you need to reload the questionnaire page and click on the line number again. The easiest way to reload is in Debug Mode.

Tip: The JavaScript function console.log() is very helpful for debugging. It displays the value of a variable in the console.
Tip: The console allows you to type JavaScript code directly. This makes it easy to test code, and the console output provides valuable information about which fields a JavaScript object contains, for example, an input field.

Issues with Audio/Video
If an audio or video file is not playing, the error console (see above) usually provides good hints about the issue. The most common causes are:
- The HTML code is incorrect
- The filename is incorrect (case sensitivity matters, even in file extensions)
- The video file is incorrectly encoded
An incorrect HTML code is often indicated by the fact that a video or audio element does not appear at all. In many cases, no errors show up in the console. However, clicking on the element in the Inspector (see above) might help.

In this example, this only helps to a limited extent … only a trained eye would notice that it should be <source> instead of <sources>. A useful approach is to copy code examples from the guide into the questionnaire and adjust them step by step.
It becomes easier when the video file simply cannot be loaded.
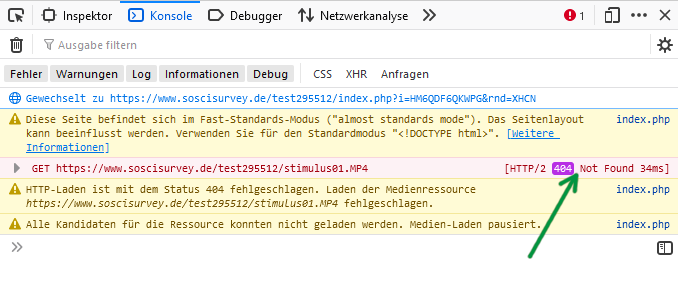
If access to a file fails, the console shows a 404 error (file not found). The easiest way to troubleshoot this is to check the Images and Media Files section in SoSci Survey and look for the missing file.
- Is a
pro://missing before the filename because the file was uploaded to the “protected file storage”? - Was the filename misspelled, like
stimulus.MP4instead ofstimulus.mp4? - Or was the file simply not uploaded to the survey project yet?
Filenames using pro:// are rewritten when the questionnaire page is generated. So, it is perfectly normal to find something different in the HTML code than what you originally wrote.
If the file is found but incorrectly encoded, this will be evident in the error console. The message will indicate issues with encoding or decoding.
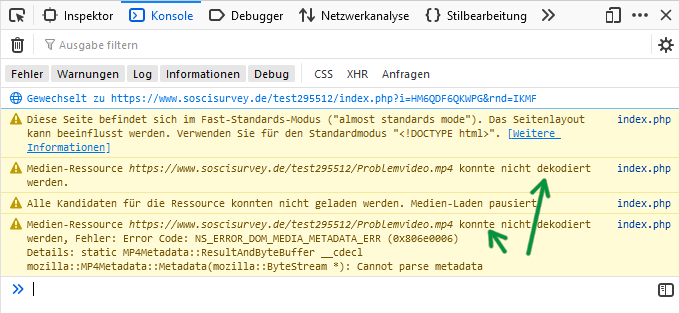
First, try opening the file directly in the browser. If multiple files are linked, try opening each one individually. For example, if the file is named stimulus1.mp4 and the project runs at https://www.soscisurvey.de/Testprojekt/, enter the URL https://www.soscisurvey.de/Testprojekt/stimulus1.mp4 in the browser. For files in the protected storage (pro://), retrieve the temporary filename from the Inspector.
If the file opens directly in the browser, the issue might simply be the type=… specified in the HTML code. If the file does not open even when accessed directly, it likely needs to be re-encoded. If you're unfamiliar with file encoding specifications, an online service like CloudConvert can be helpful. However, some issues might still go unnoticed—for example, certain file formats require width and height to be divisible by 8 or 16.
Search terms: Error Console, Browser Console, Developer Console, Developer Tools, Playing Videos, Video Files, Audio Playback, Audio Files
