- de
- en
This is an old revision of the document!
Table of Contents
Solving Questionnaire Problems
Getting started using PHP-Code and JavaScript is not always trivial – especially when you have a more complex task ahead of you, things do not always work out as expected.
To efficiently locate and fix bugs (debugging) even experienced programmers need software support. First of all, SoSci Survey (PHP-Code) or the internet browser (JavaScript) need to provide information…
- … where the problem is located, when nothing is working anymore (formal errors),
- … what is happening in the background before something appears on-screen, and
- … whether the expected content has been saved in variables (content errors).
Formal errors are the easiest to find. When a semicolon is missing at the end of a command or a missing bracket (syntax error) the command code won't even be executed. SoSci Survey will then show an error message. Therefore the error console has to be opened.
Content errors are harder to find. The code is working, but does not produce the desired outcome. In this case the background display can help to show what is actually happening (example).
Locating errors in PHP-Code
Open the questionnaire in debug mode by clicking on the yellow arrow next to run questionnaire . Use the yellow arrow with protruding line
  to start debug mode from a specific page.
- In debug mode () and in preview mode (
 ) you see warnings (orange) and hints (yellow) for possible problems that are not being displayed in the normal questionnaire (e.g., by applying
 value()to a variable that has not yet been used). - In debug mode the identifier and description is being displayed next to every question. Move your cursor over the description to make additional notes to the question. They will also be displayed in the question catalog when opening a question for editing.
- In debug mode you have an additional control panel at the top (debug panel) to show you additional information to questions.

On the left side you can click on DEBUG ►, if the strip should overlap or be in your way. In case you only see a small, yellow push-button ◄ DEBUG on the top right of the questionnaire, click on it to open the full debug panel.

Note: If you start the questionnaire in debug-mode, you will find this later in your data. It will have “debug” (Additional Variables in the Data Set) displayed as its variable MODE. Use data obtained → show data to inquire into your saved data.
Navigation
You've got a question designed to filter on page 2, however, the actual Filter is found on page 10? Use the navigation in the debug control panel to directly switch between the pages.
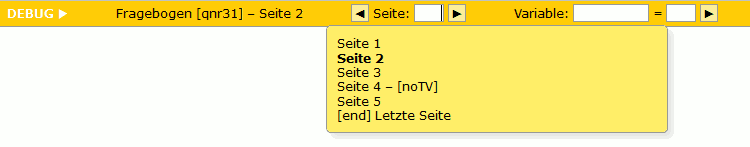
- If you move your cursor over Seite: a list of all pages of the whole questionnaire will be displayed. Click on each entry to be directly taken there.
- Alternatively, you can use the input box next to Seite: to enter the page number and the Return-key or click on the arrow (►).
- Use the arrow pointing left (◄) to return to the previous page of your survey – even if you do not offer a “go back” for the participants.
- Use the arrow pointing right (►), to get to the next page without checking on integrity (obligation to respond/tackling the response).
Hint: If you directly jump to another page, the data provided will be automatically saved so you do not need to click the “next” button.
Survey Route
If you work with goToPage() or
setPageOrder() , you might want to retrace which pages have been displayed over the course of the interview. Move your courser over the name of the survey to do so.

You will see a list of pages that have been shown over the course of the interview. The most recent position will be shown in bold. By means of setPageOrder() or setNextPage() you can decide which page shall be shown after clicking on “next”; this will be shown in the list as grey.
Debug Information
Whenever you work with PHP code, the debug information will give you helpful input. Click “debug information” on the top right to have the window (dis-)appear.

The debug information shows the relevant steps that have taken place in the background in between the start of the current page (e.g., by clicking on “next”) and the display of the page on screen. Here you can see:
- … which answers have been read and saved on your data (“Lese Antworten von Seite …”) and
- … what has been processed on the current page (“Erstelle Fragebogen-Seite Nr. …”).

Filter Questions
The example used shows a survey page with a small Filter.

The command value() automatically generates an entry in the debug information. You can look at Debug-Information , to see that the PHP-Code used the command value('AB10') to deliver a value of 2.
Further, you can observe that item “AB09” is displayed, but “AB05” is missing in the filter – since the value of 2 deliverd by value() is unequal to 1, for which is being filtered.
Variables
Using the command debug() you can see the value of any variable in your data set or PHP-Code. As an example serves the following page of a questionnaire, which calculates a new value out of an open text entry of a participant in “AB11_01” while using a filter.

In this case the command debug() has been used twice. The parameter is once the identifier of the free text entry “AB11_01” and in the other case the PHP variable $num, in which the result of said calculation is saved in.
In debug mode debug() generates an output in the questionnaire itself, as well as in the Debug-Information. In the normal interview you won't see any of it.
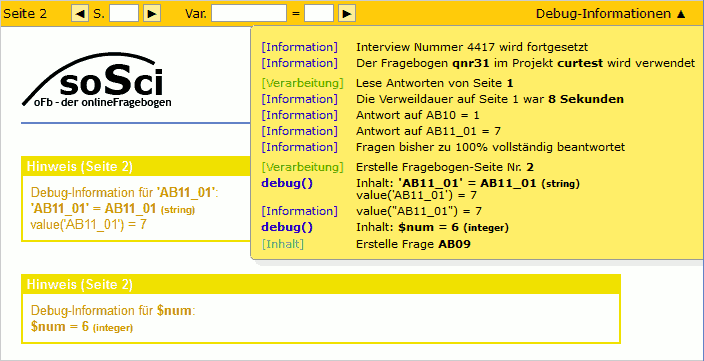
By first using debug(), SoSci dutifully tells you that the parameter is a string with the content “AB11_01”. Further, it will be recognized that it is the identifier of a variable from the data set. Which is why automatically the value (6) of the data set is shown.
By the second use of debug(), SoSci will show you which current value of the PHP variable $num is saved (6).
Empty Pages
If any page of the survey does not display any content, SoSci Survey automatically skips towards the next page. This might happen if, for example, questions are only shown depending on a filter. In the following example, item “AB05” is only displayed if the participant has chosen a value of 1 in question AB10.

In the Debug-Information not only can one observe why item “AB05” is not shown but also that it will automatically continue with page 4.

Furthermore, on the top left you can find the page numbers “3+4”, which means that these pages will be shown at once. This display also results if you use goToPage() : this command takes you directly from one page of the questionnaire to another.
Example
The following PHP code shall if the value of the sum is 25 jump directly to another page of the survey and there (above other questions) show a specific text information – but the text cannot be found:
if (valueSum('AB01') >= 25) {
  goToPage('noTV');
  text('noTV');
}
Here only the output of the debugging mode will help (Debug-Information). This shows that the command text() is not being executed, the goToPage() however is. Thus it is not the filter that produces the problem.
Take a look a the initial of the command:goToPage(). It tells us that it will make you jump to the specific page directly without executing anything else on the page of origin. In this example, not even text(). If you are aware of the cause, the solution is simple: Move text() in front of goTopage().
if (valueSum('AB01') >= 25) {
  text('noTV');
  goToPage('noTV');
}
Finding Bugs in Java
While the PHP code of SoSci Survey is being executed on the server, JavaScript will run in the browser of the participant. Accordingly the browser is responsible for finding errors and information.
To do so, the error log is needed. One can find it – depending on the browser – at different places. (Shortcuts (engl.), Wordpress (engl.), How to Open Developer Tools (engl.)).
Use the command console.log() to find additional information in the error log. Accordingly, the following Java script code would, e.g., look for an element with the HTML-ID “AB01_01” – and display the same in the error log if it finds it.
<script type="text/javascript">
<!--
var input = document.getElementById("AB01_01");
console.log(input);
-->
</script>
Browsers nowadays additionally offer an “inspector” or “DOM Explorer” or the like. This allows for clicking on an item on a given page of the survey (a text box, for example), to find further information (e.g., the HTML_Code incl. the HTML-ID) of said item.