
- de
- en
Table of Contents
Tips for the Survey Design
This page collates a couple of tips to avoid problems regarding the measuring instrument. The list is not complete and there are exceptions to every rule - generally though, the following tips avoid effort, hassle and resentment during the data analysis.
Conceptual Design
Separate Research Questions from Survey Questions
The questions you ask in the questionnaire are called Survey Questions. The wording of these questions significantly impacts the quality of your questionnaire. The most common mistake is to word the survey questions in a way that closely resembles the research question (“To what extent was your consumption decision influenced by the advertising material presented earlier?”). Another common mistake is that the survey questions hardly relate to the research project. In both cases, the research questions have usually not been conceptually separated from the survey questions.
Systematically working from the research question through to the survey questions usually leads to (a) comprehensible questions, which (b) deliver the necessary data for the analysis.
- The research question is the fundamental question of the research project.
For example: How do various advertising media influence the consumption decision? - Usually, several hypotheses emerge from the research question.
For example: What kind of advertising to customers and respectively non-customers notice? Was the campaign XY generally noticed by the target group? Does the TV commercial generate higher awareness than the print advertising? - A critical step is the transfer of hypotheses into constructs. Those are the variables you want to measure in your survey - variables that can be quantified. The constructs are critical with regards to (i) every construct needed to test the hypotheses must be measured (ii) you should limit your questions to these constructs.
For example: age, gender, recall of campaign XY on TV, recall of the campaign on billboards, intention to buy, recall of the TV commercial. - From these constructs, the survey questions emerge. These questions must be phrased in a way that the participant understands them (no technical terms) and is able to answer them reliably with his or her knowledge. Some constructs can be measured with one question, others need lengthier scales.
For example: How old are you? Have you seen the TV commercial for the new XYZ? Which of the following statements apply to you: I have thought about buying the new XYZ. …
Tip: Make a note of your hypotheses and the corresponding constructs. You may be surprised what mantraps you have overlooked so far.
Conduct a Pretest
The validity of the questionnaire depends on two principles: the theoretical foundation and the comprehensibility. For the latter, there are loads of good tips in books. But no tool is as good at finding problems as a Pretest of the Questionnaire is.
Pretesters should not check spelling and grammar - this should be done prior to the pretest, otherwise problems with regard to content may not be detected.
Limited Completion Checks
In the ideal case, every participant answers all questions, and when asked for their age, you of course want participants to enter digits only. Such restrictions can be easily implemented in the online questionnaire.
The tip is: do not do it! There is usually a good reason for motivated participants to not answer a question, e.g. they cannot answer the question. Unmotivated participants usually drag down data quality anyway.
There are always people who just want to look at a questionnaire. If you force them to answer questions, they will enter something: usually junk data. However, in the data set you may not recognise this anymore - only the overall bad data quality. An empty data record on the other hand is easy to identify and delete.
Nevertheless, forcing an answer and allowing only defined characters are eligible when the responses are needed for filters or similar features.
Structure of the Questionnaire
If you follow some general recommendations1), the questionnaire is coherent for the participant, you reduce the number of dropouts and avoid irritation, which usually leads to better data.
- The questions at the beginning of the questionnaire should be easy and pleasant to answer. The opening questions should create a conversational situation for the further questions (also in online questionnaires!)
- The opening questions should explicitly address the announced topic of the survey.2)
- Questions on the same topic or subject should be asked directly one after the other.3)
- Questions on the same topic or subject should be arranged from the general to the specific.
- Sensitive questions that may make some respondents feel uncomfortable should be placed at the end of the questionnaire.
- Use filter questions so that participants are not asked questions that are irrelevant to them.4)
Wording of Questions
For the wording of questions, Krosnick and Presser (2010, p. 264)5) give valuable recommendations:
- Use simple, familiar words (avoid technical terms, jargon and slang).6)
- Use simple syntax (short sentences, few subordinate clauses).
- Avoid ambiguous words. The goal of the wording is that all participants understand or interpret the question in the same way.
- Be as specific and concrete as possible (as opposed to general and abstract wording).7)
- Answer options must be exhaustive and mutually exclusive.
- Avoid one-sided or judgmental question wording that pushes participants towards one of the answer options.
- Always ask about only one issue (avoid multidimensional questions).8)
- Avoid questions with single or double negations.
Room for Interpretation I
There are countless terms that different people understand differently. For example, “rarely” and “often”. If you ask how often someone uses social online networks (such as Facebook), “rarely” means “only once a day” for one person and “only once a month” for another – depending on what the respondent perceives as “normal”. With a scale “never/rarely/occasionally/often”, you would therefore only measure how respondents see themselves in comparison to their peer group, but you do not get a valid measure of the amount of use. If you want to measure the amount of use, you should definitely specify absolute numbers, e.g. “about once a month”, “about once a week”, …
Room for Interpretation II
By the way, the same problem exists with supposedly clear terms. Facebook use, for example. Should not everyone know what is meant here? No, because one person opens Facebook in the morning, leaves the page open in the background all day and looks into it 10 times a day. Another person opens the Facebook app on their smartphone 10 times a day. Although both check the news equally often (you could validly ask about this), one would classify themselves as “daily”, the other as “several times a day” – a source of error of 20% on a five-point scale. And if 90% of the participants use Facebook often or very often anyway, the error can account for 80% (!) of the explained variance. You then need not expect significant correlations anymore.
Content and Form
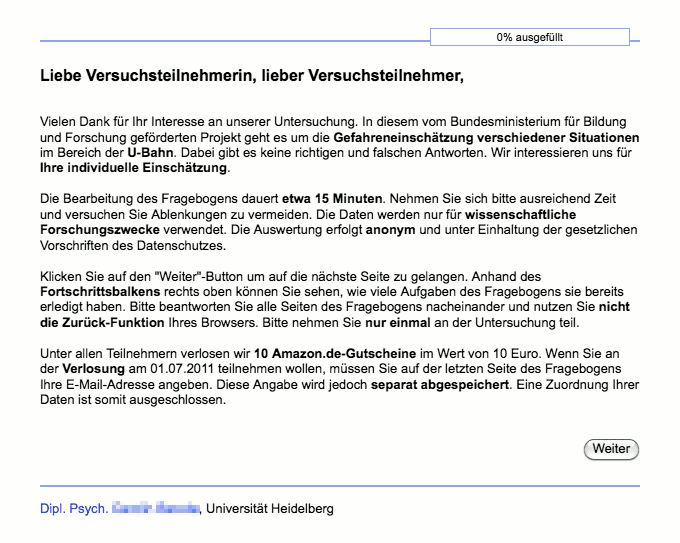
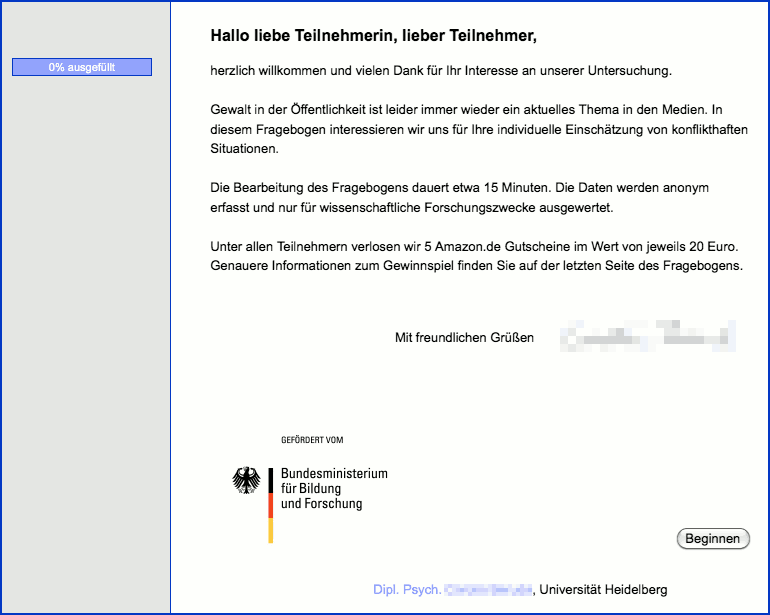
The first impression can make the difference between a 5% and a 20% response rate – this section gives some recommendations on how not to chase away your participants by the layout alone. The following welcome screens of the same project (before and after optimization) illustrate the effect of a clean design.
| Before | After |
|---|---|
 |  |
| (click to enlarge) | |
Tidy Look of the Questionnaire
Not everybody has an intimate relationship with HTML. But simple formatting such as paragraphs and headings is very easy to program with a bit of HTML code (Texts in the Questionnaire). You should definitely use these: the welcome text on the first page is the business card of the questionnaire. If this page looks professional and contains a logo of the institute and/or the university (Images in the Questionnaire), people are more likely to complete the questionnaire.
SoSci Survey offers loads of options to design the questionnaire. If you do not make use of these opportunities, a low response rate may be the result. Of course you also need to take care of the spelling and the display of the questions (Optimise the Display of Questions).
A brief checklist for a well-designed questionnaire (see also below A Short Welcome Page):
- Text input fields are optimised for the anticipated content (e.g. specified width and characters, in case a number is anticipated).
- Valid contact information, so participants can see whom they shall trust.
- Spelling and grammar in texts and questions have been checked.
- Only short texts are used (e.g. maximum 4 paragraphs with 3 lines each on the welcome page).
- Short and simple sentences are used in questions.
- Every question looks well-designed, no texts are out of line, line breaks (e.g. also in scale labels) look tidy.
A Short Welcome Page
What is wrong with my writing?
Well. For starters, you use too many sentences.9)
A participant following a link to the questionnaire usually expects a brief welcome. The text should not be longer than 800 characters. Less is more – especially regarding the conversion rate! If you want or need to provide more information, put this on a separate page and link to this page in your welcome note. Some important parts for the first page:
- A friendly welcome
e.g. “Welcome to the XY survey”, “Dear participant”. - A logo of the university, department or company – if not incorporated into the layout already.
- Topic of the questionnaire – a rough idea is more than enough, too many details may harm the data quality
e.g. “Public opinion poll”, “regarding the quality of education at XYZ university”, “regarding the current economic situation”, “regarding a technological innovation”, “regarding a political campaign for the upcoming elections” etc. - An indication how long it takes to complete the questionnaire.
- A note regarding the involvement of an institution
e.g. “at XYZ university”“, “as part of the module ABC”. - If your research is being funded or otherwise linked to institutions (e.g. funding by a research council), display the according logo to present your high standards.
- End with a salutation and the name of a contact.
The same advice also goes for the content of the text, as well as for invitation emails: Optimize your E-Mail-Invitations
In a lot of cases, you want to reduce social pressure in order to get the most honest responses possible (“there are no right or wrong answers…”). This sort of guideline is best placed where you ask sensitive questions - it would be skimmed over quickly on the welcome page. A good example of formulating this kind of guideline would be:
The answers you give to these questions can't be right or wrong. We are more interested in your perceptions, opinions and habits. It's not a bad thing if you're not completely sure about the answers you give - most questions can, and should be, answered going on your “gut feeling”.
Questions Instead of Standard Forms
People know standard forms from different instances. These forms are usually labelled very short and precise: “Date of Birth”, “Residence”, “Address”. What do you associate with these kind of forms? Petitioners, paperwork, and red tape.
If you want your participants to feel comfortable during your survey, ask them proper questions (“Where did you spend your last holidays?” instead of “Last holidays:”) and briefly explain the context of your questions (e.g. “Following we want to ask you a couple of questions regarding your last holidays.”) – especially when the topic of the questions changes (“The following questions relate to experiences on your last holidays”).
By asking questions, a hint of a real conversation is created and participants get a better idea of what you want to know. Of course you don't need to exaggerate: sociodemographic data can still be asked for in a very precise fashion. However, a friendly “Finally, we want to collect some information about yourself” surely doesn't harm.
Formatting
Avoid using too many emphases (bold, italic, underlined).
- Bold emphases often look unprofessional, since they negatively influence the typeface.
- When many words are emphasised, the nature of an emphasis is lost. Limit yourself to one word per paragraph if you really want to emphasise something.
Get to grips with the most important HTML tags.
- A line break (
<br>) and a new paragraph (<p>) are not the same. When using multiple paragraphs, make sure they are paragraphs – and not double line breaks. - If you want to use a list, it is not enough to just put hyphens at the beginning of a line. A proper list that is indented correctly after a line break can be created using the HTML tags
<ul>and<li>. - For headings, there are the tags
<h1>to<h6>– bold formatting via<b>or<strong>is only rarely suitable for a heading, because the spacing is not adjusted, not to mention the accessibility for screen readers. If necessary, the font sizes for the headings can be adjusted in the layout using CSS.
Do not make the typical typographic beginner mistakes – make sure that your text looks like a professional survey.
- Do not divide your text into too many paragraphs. If every full stop is followed by a new paragraph, your text is pulled apart.
- Avoid using different font types and sizes. Homogeneous texts look more professional. Once you have decided on a format for different kind of texts (e.g. bold and larger headings, underlined emphases), constrain yourself to using these formats.

