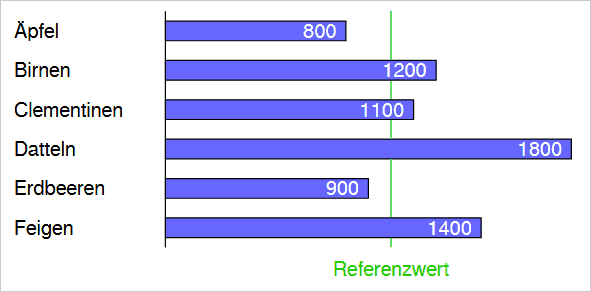
barchart()
The function barchart() inserts a bar chart into a report.
ReportElement barchart(array data, [array settings])
- data - An array with labels as keys and numeric values.
- settings - An array with (optionally) the following keys:
'ref.value'– Display a reference marker (vertical line) at this value'ref.color'– Color of the reference marker'ref.label'– Label of the reference marker'color'– Color for the axes and the outline of the bars'color.bars'– Color of the bars'color.values'– Color of the labels (values) within the bars'format'– Formatting for the labels of the bars- Format string for
sprintf(), e.g.,%01.2f%for a decimal number with 2 decimal places. %tsd …– Formatting with a thousands separator, e.g.,%tsd €for1.234 €.
Usage
Use barchart() within a box() to specify the size of the chart.
$data = [
  'Apples' => 800,
  'Pears' => 1200,
  'Clementines' => 1100,
  'Dates' => 1800,
  'Strawberries' => 900,
  'Figs' => 1400
];

add(
    box([
        'height' => 60,
        'width' => 120
        ],
        barchart(
            $data,
            [
                'ref.value' => 1000,
                'ref.color' => '#00CC00',
                'ref.label' => 'Reference value',
                'color.bars' => '#6666FF',
                'color.values' => '#FFFFFF',
            ]
        )
    )
);